- Joined
- Jun 27, 2021
- Messages
- 5,386
- Reaction score
- 422
Section 1.1
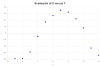
Question 16
Sketch a scatter plot of the data
shown in the table.
See attachment.
The idea here is to plot the x and y values on the xy-plane.
What is the main goal of a scatter plot?
Is this not a statistics lesson? Why would it be in Section 1.1 in a precalculus book?

Question 16
Sketch a scatter plot of the data
shown in the table.
See attachment.
The idea here is to plot the x and y values on the xy-plane.
What is the main goal of a scatter plot?
Is this not a statistics lesson? Why would it be in Section 1.1 in a precalculus book?